by Doug Ward
CHICAGO – Call it “a great awakening” of faculty.
That’s how one Indiana University instructor described the use of learning analytics to George Rehrey, founding director of the university’s Center for Learning Analytics and Student Success.
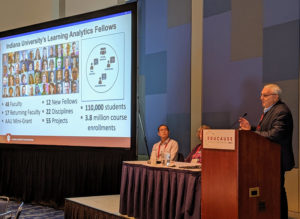
Rehrey spoke last week at Educause 2019 about learning analytics, which includes such things as student demographics and data about courses, programs and grades, and were until recently the sole purview of program advisors and offices of institutional research. As universities have made that data available to faculty members, though, it has provided a new way for instructors to analyze the effectiveness of their courses and curricula. It has also opened a window into student behavior and made faculty more invested in student success, Rehrey said.
“This is really a shift in the way we can think about teaching and learning,” he said.
Rehrey oversees IU Bloomington’s Learning Analytics Fellows program, through which more than 50 faculty members from 22 disciplines have explored questions about their courses, students and curricula over the past five years. Those inquiries have included such topics as how peer networks and students’ experiences in classes influence their decisions on majors, how librarians’ instruction sessions aid academic success, and whether the method of course delivery (online, in person, hybrid) makes a difference in learning. A project on how students react to unexpected grades received a mini-grant from the Association of American Universities earlier this year.
Indiana is the leader of the Bay View Alliance’s research initiative in data analytics. That initiative includes the University of Kansas, the University of California Davis, the University of Saskatchewan, the University of British Columbia, and Queen’s University in Ontario.
Rehrey and Doug Ward, a faculty member at the University of Kansas and associate director of the Center for Teaching Excellence there, also presented a poster at Educause about BVA-related work in data analytics. The poster, titled “Faculty Education, Learning Analytics, and the Complexity of Higher Ed,” looked at how Indiana, Kansas and the University of California Davis, have developed and expanded programs to use data to improve student success.
Kansas received a mini-grant from the AAU for a project to help STEM departments improve student success through the use of university analytics. That project has since evolved into Ideas to Action, a program that helps departments across the university explore data-informed questions as part of broader efforts to improve learning, retention and graduation.
UC Davis received a $1 million grant from the Howard Hughes Medical Institute to help close an achievement gap for underrepresented minorities. As part of that grant, the university will expand use of a Know Your Students dashboard, which provides an overview of student demographics, previous performance in courses, and outcome gaps. That dashboard was started with a grant from the Helmsley Trust.
Ryan Goodwin of the University of Central Florida also contributed to the poster. Central Florida modeled its Predictive Analytics Innovation Fellows program after Indiana’s analytics program.
A “middle out” approach
Indiana, Kansas and UC Davis use what Rehrey called a “middle out” approach to culture change. That is, they focus on academic departments as a catalyst for university change, an approach that has been at the heart of the work of BVA-related initiatives. Under that approach, faculty members who are willing to make changes in their courses are recruited for teaching-related programs. That work helps spread new ideas to others in a department and, when successful, shifts the attitudes and culture of a department.
The use of learning analytics has proved powerful in aiding that process, especially in the way it can debunk educational myths, Rehrey said. He gave the example of a STEM department whose faculty assumed that many students were leaving their program because they weren’t smart enough to succeed in an early class. University data showed, though, that half of those students received a B average or higher in the class. That showed the department that it needed to dig deeper for answers, Rehrey said.
University data has also provided new ways for faculty to track the success of changes they make in their courses as students move through a curriculum. University data makes that possible, Rehrey said, but only if faculty are willing to ask questions about student learning and adopt innovative methods in teaching and learning.
“If faculty don’t embrace it, it doesn’t stick,” he said.
Looking at learning differently
Those who have embraced learning analytics have started to see their role in student learning differently, Rehrey said. That’s why one faculty member described the process as “a great awakening,” a term often used to describe times of increased religious fervor that helped spur political change in Western society. In this case, though, the awakening refers to a greater understanding of student learning, student needs and students’ pathways to graduation.
That awakening has also helped create a sense of community among faculty who are using learning analytics, Rehrey said. It has started to shift the culture in some departments.
“The big tell will be when departments use learning analytics to make decisions,” Rehrey said. “When someone says, ‘I have some data about that,’ that’s when we know we will have culture change.”
