Online Assessment of Student Learning
BVA campuses have been collaborating to develop a concise resource for assessing student learning online, as many faculty will be doing this coming fall—and perhaps beyond. Online assessment presents a number of challenges but also opportunities to explore alternative approaches that provide rich information about what students know and that also deepen and extend their learning. The COVID pandemic makes these approaches especially timely, but they are relevant as well in the face-to-face settings we all hope to return to soon.
Click here for a pdf version of the full BVA Online Assessment Resource
Click here for a pdf of Reports from Campus-Based Workshops on the BVA principles for online assessment
bl923″]
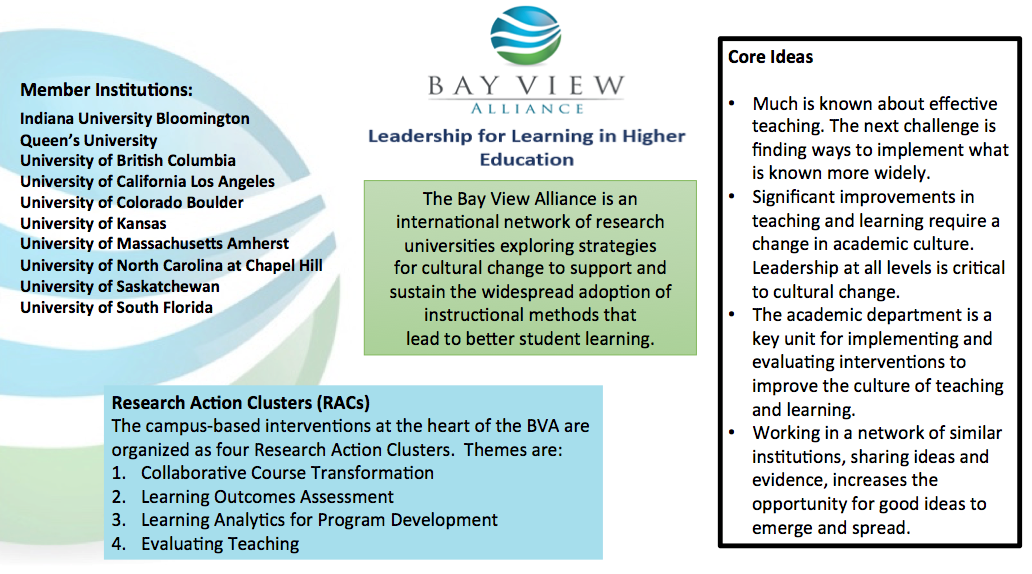
BVA Overview Poster
Driver Diagram
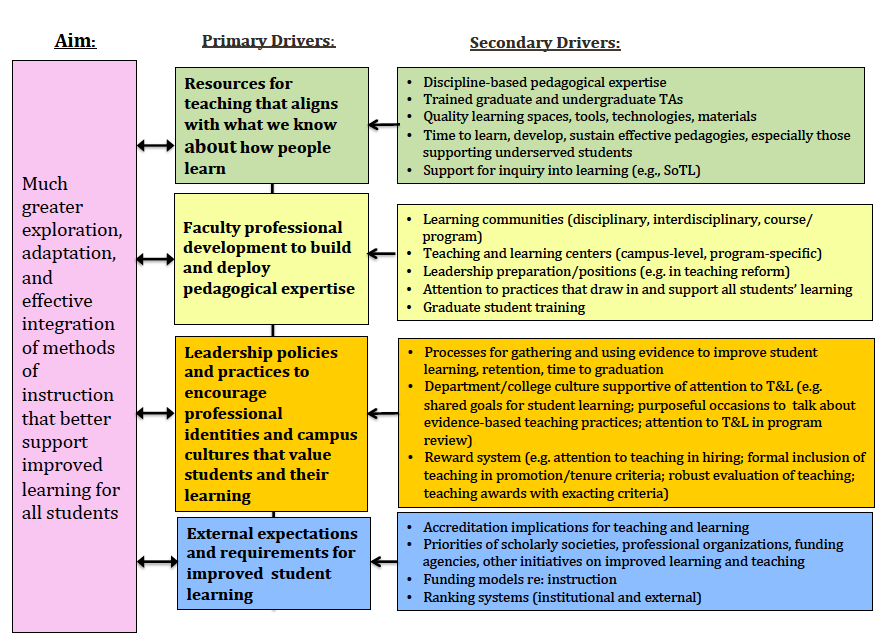
Often used in Improvement Science, a driver diagram is a tool for representing the causal thinking behind a change initiative–its aim and the interventions (drivers) needed to accomplish it. In this way, a driver diagram reflects a process of backward design.
Looking at the BVA driver diagram above, you will see our aim in the box on the far left: “much greater exploration, adaptation, and effective integration of methods of instruction that better support improved learning for all students.”
Moving to the right, the middle column captures four broad areas (primary drivers) in which change will need to occur to achieve our overarching goal. For instance, departments will need more “resources for teaching that aligns with what we know about how people learn” in order to shape their efforts at course and pedagogical transformation.
The next column to the right then specifies more concretely (through secondary drivers) what those resources might include: discipline-based teaching expertise, trained graduate and undergraduate TAs, quality learning spaces, tools, technologies, materials,” and so forth.
Many of the primary and secondary drivers connect to work underway through the BVA’s Research Action Clusters (networks of campuses exploring a particular intervention to address a a common problem), working groups, and collaborative projects.
A driver diagram is a “living tool” that can be modified and augmented as the work progresses. The version that you see here represents several rounds of refinement over a number of years. It will continue to change.
We hope it is helpful in understanding the logic behind the BVA’s evolving work–and also in understanding how that work relates to similar initiatives being undertaken by other groups. [See for example, the Association of American University’s Undergraduate STEM Education Initiative].
For more about driver diagrams, see: Bryk, Anthony S., Gomez, Louis M., Grunow, Alicia, and LeMahieu, Paul G. (2015). Learning to Improve: How America’s Schools Can Get Better at Getting Better. Cambridge, MA: Harvard Education Press, pp. 73-80.

